Just watched a session on Chrome Developer tools, Shay Friedman from NDC London. Even though I use the Chrome Developer tools quite a lot, there was still a few new things to me. I took some quick notes while watching the video, so you don’t have to spend an hour watching it.
Source
While on the source tab.
Ctrl+o/ctrl+p (search for specific javascript file)
Ctrl+shift+p (find in javascript file)
you can dynamically write debugger; in the code file to make a break point
[javascript]console.log("this is text", this); [/javascript]
Will log the object to the console with the text
Workspaces can be used to sync file changes to a folder
[javascript]console.count("name") [/javascript] Counts the number of occurrences, to the console
[javascript]console.groupCollapsed("name")[/javascript] All console.log statements following this statement will show as a group as in the console.
[javascript]console.groupEnd()[/javascript]ends the grouping of the log statements.
[javascript]console.time("name") [/javascript] times the javascript wrapped in the time(“name”) and [javascript]console.timeEnd("name")[/javascript].
You can use the devtools snippets to store collection of script snippets, a good resource is http://bgrins.github.io/devtools-snippets/.
HTML
Shift click color code box (change representation)
Search in HTML (can be CSS selectors)
Console
Change text (to check for language specific texts and how they affect the design)
[javascript]document.body.contentEditable = true [/javascript]
Developer Tools Settings
Make sure to Disable Cache when dev tools are opened.
Check: Show time stamps
Allow custom theme (get a black theme) (http://devthemez.com/themes/chrome-developer-tools)
Use the device testing functionality
Click events are changed to touch events
Check network speeds
Check Offline mode
The network tab
Blueline document ready
Red line (images+iframe) done loading
Latency should not take up most of the Time column
Size and content should not be the same (because then they are not zipped)
When there is an error, right click network tab, save as HAR with content (http://ericduran.github.io/chromeHAR/)
Timeline
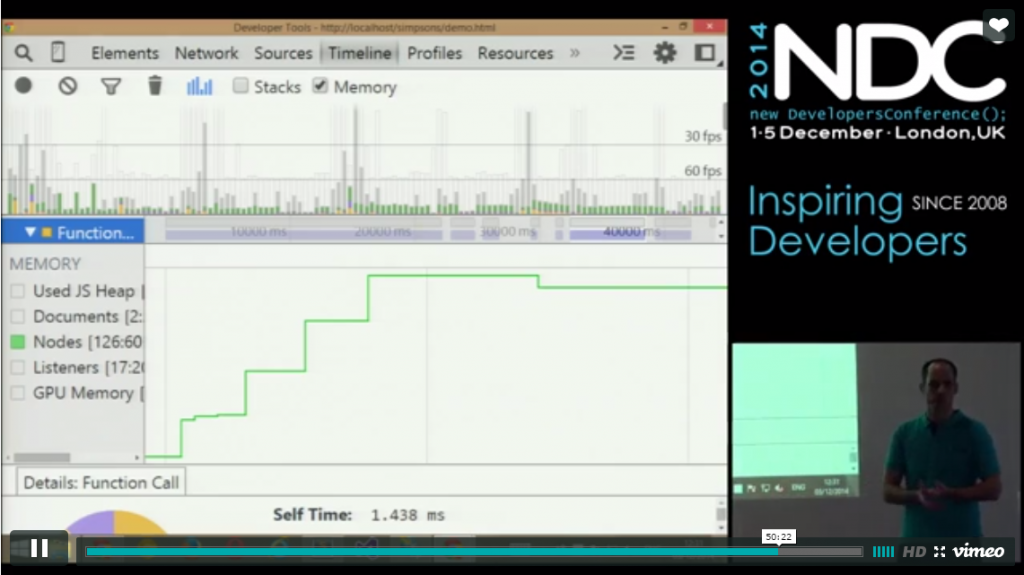
Click at the gabage collection button (multiple times) before stopping collecting data. Don’t have references to DOM objects around, it’s a leak if the DOM object is removed.
Look at the node graph
